Market Reports
May 26, 2026
NYC Construction Report: Q1 2026 Permit Filings Surge Citywide
January 1 - March 31, 2026
In December 2024, the New York City Council passed City of Yes for Housing Opportunity, a sweeping zoning amendment designed to unlock the residential construction this housing-starved city badly needs. A little over a year later, the first-quarter 2026 permit filing data suggests the reform is already delivering, and delivering emphatically.
An analysis of Department of Buildings new-building permit filings for the first quarter of 2026 (January through March) shows 28,773 proposed residential and hotel units citywide, a dramatic jump from the previous year's average quarterly tally of 14,338. The total number of filed permits climbed from an average of 686 per quarter in 2025 to 793 in Q1 2026, and filed-for square footage more than doubled, rising from 16.9 million square feet per average quarter last year to 34.6 million square feet in the first three months of 2026. Below, we break these numbers down by month, borough, building size, and floor area, and look at what the pipeline means for buyers and sellers watching the luxury market today.
28,773
Units Filed, Q1 2026
793
Total Permits Filed
34.6M
Square Feet Filed
+101%
Units vs. 2025 Avg. Qtr
+16%
Permits vs. 2025 Avg. Qtr
+105%
Sq. Ft. vs. 2025 Avg. Qtr
Monthly Permit Filings Accelerate Through the Quarter
Every month in the first quarter beat its 2025 counterpart by a wide margin: permit filings rose 71 percent in January, 49 percent in February, and nearly doubled (up 99 percent) in March. January, the quarter's slowest month, nearly matched December 2025's filing count, previously the strongest month of last year. March, the strongest month of Q1 2026, more than doubled last year's monthly average. The current quarterly average of 264 permits per month is a meaningful step up from last year's pace.
New Construction Permits Filed by Month
January through March, 2025 vs. 2026
Permit Filings by Borough
The general pattern held steady this quarter: the larger the typical proposed building in a borough, the fewer permits it tends to file overall. What stands out is that every borough posted growth, from a 20-percent increase in Staten Island to a 133-percent surge in Manhattan, though Manhattan's permit count still trails the other boroughs given its larger average building size.
New Construction Permits by Borough
Average quarter 2025 vs. Q1 2026
Permit Filing Growth by Borough
Percent change vs. average quarter 2025
A Surge Across Every Building Size Category
The first quarter registered permit filings for 1,672 new residential and hotel buildings, a figure that nearly matches all of 2025's combined 12-month total of 1,972. Growth showed up in every size category, with buildings of 50 units or more roughly doubling compared to last year's quarterly averages.
Permit Growth by Building Size
Percent change in unit count per filing vs. average quarter 2025
The ten largest filings by unit count this quarter were concentrated in Manhattan and Brooklyn:
- 1.548 West 36th Street in Hudson Yards, Manhattan, 1,458 units
- 2.495 Eleventh Avenue in Hudson Yards, Manhattan, 1,023 units
- 3.18 India Street in Greenpoint, Brooklyn, 834 units
- 4.6202 8th Avenue in Sunset Park, Brooklyn, 549 units
- 5.2560 Boston Road in Allerton, The Bronx, 483 units
- 6.484 Eighth Avenue in Midtown South, Manhattan, 481 units
- 7.407 West 206th Street in Inwood, Manhattan, 474 units
- 8.460 Tenth Avenue in Hudson Yards, Manhattan, 456 units
- 9.170 West 48th Street in Midtown, Manhattan, 419 units
- 10.498 Columbia Street in Red Hook, Brooklyn, 369 units
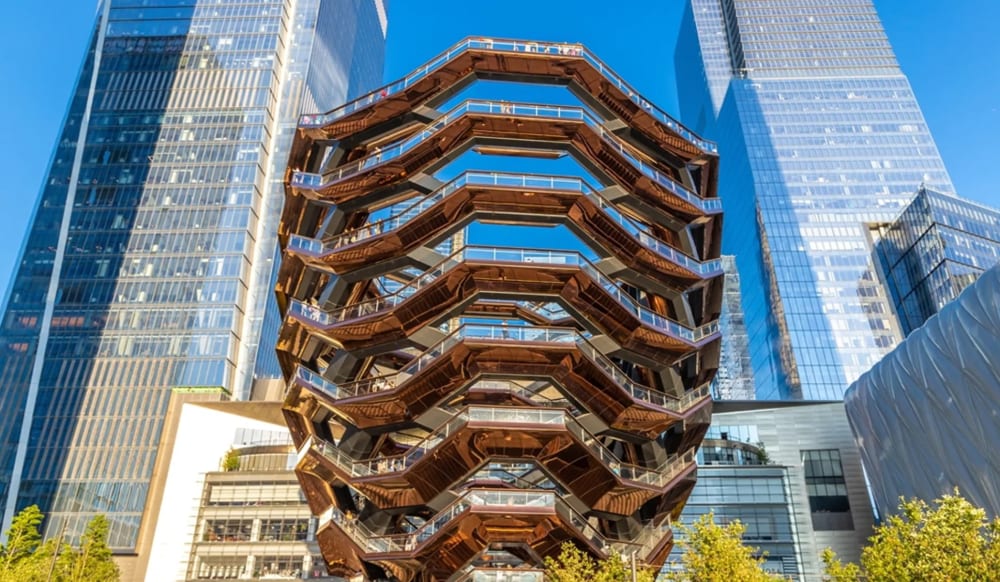
The quarter marked a resurgence in a once-quiet Hudson Yards, which claimed three of the ten largest filings, including the two biggest. The remainder of the list splits between Manhattan and Brooklyn, with the fourth-largest filing landing in Sunset Park, a long-underbuilt immigrant-anchored corridor in Brooklyn that is only now seeing the density its commercial strip has long supported.
Residential and Hotel Units by Borough
The combined unit total of 28,773 for the quarter, while still modest against the scale of the city's housing shortage, reflects meaningful growth in every borough, led by a near-quadrupling in Manhattan.
Residential and Hotel Units Filed by Borough
Average quarter 2025 vs. Q1 2026
- •The Bronx: 2560 Boston Road in Allerton, 483 units
- •Brooklyn: 18 India Street in Greenpoint, 834 units
- •Manhattan: 548 West 36th Street in Hudson Yards, 1,458 units
- •Queens: 40-25 Crescent Street in Long Island City, 260 units
- •Staten Island: 930 A West Fingerboard Road in Grasmere, 50 units
Notably, most of these borough-topping filings sit outside each borough's central skyline core, a sign that City of Yes is spreading development more evenly across the city rather than concentrating it further in already-dense hubs. The one partial exception, Long Island City, borders Astoria and remains adjacent to Queens' primary development corridor.
Taller Buildings Across the Board
New building permits filed in just three months were substantial enough to leave a real mark on the skyline: 105 filings for buildings between ten and 19 floors, 30 towers between 20 and 49 floors, and three proposals in the 50-to-99-story range, including a supertall planned for 175 Park Avenue in Midtown, Manhattan.
Permit Growth by Floor Count
Percent change vs. average quarter 2025
The tallest permit filings of the quarter, by floor count:
- 1.175 Park Avenue in Midtown, Manhattan, 95 floors (office)
- 2.548 West 36th Street in Hudson Yards, Manhattan, 70 floors, 1,458 units
- 3.495 Eleventh Avenue in Hudson Yards, Manhattan, 60 floors, 1,023 units
- 4.51 Willoughby Street in Downtown Brooklyn, 43 floors, 295 units
- 5.140 Fulton Street in Lower Manhattan, 42 floors, 99 units
- 6.484 Eighth Avenue in Midtown South, Manhattan, 38 floors, 481 units
- 7.18 India Street in Greenpoint, Brooklyn, 37 floors, 834 units
- 8.250 East 56th Street in Midtown East, Manhattan, 36 floors, 141 units
- 9.80 Clarkson Street in West Village, Manhattan, 34 floors, 129 units (tied)
- 10.460 Tenth Avenue in Hudson Yards, Manhattan, 34 floors, 456 units (tied)
While the 95-story proposal at 175 Park Avenue is grabbing headlines, Hudson Yards is the neighborhood best positioned for growth this quarter, claiming four spots on the tallest-filings list. Manhattan dominates overall, with Brooklyn and the Bronx picking up the remainder.
Floor Area Filings Grow in Nearly Every Category
Filed-for floor area rose sharply across almost every size bracket. The only modest exception was the smallest category, structures under 1,000 square feet (mostly single-car garages), which posted just a 4-percent increase, a sign that developers see stronger incentives in larger proposals even in the city's outlying neighborhoods.
Permit Growth by Floor Area
Percent change vs. average quarter 2025
The largest floor area filings of the quarter:
- 1.175 Park Avenue in Midtown, Manhattan, 3,019,530 square feet
- 2.548 West 36th Street in Hudson Yards, Manhattan, 1,361,540 square feet
- 3.80-45 126th Street in Kew Gardens, Queens, 1,107,720 square feet
- 4.6202 8th Avenue in Sunset Park, Brooklyn, 1,048,610 square feet
- 5.18 India Street in Greenpoint, Brooklyn, 788,929 square feet
Most of the largest floor area proposals sit in Manhattan, as expected given the borough's average building scale. One notable entrant, the Kew Gardens filing in Queens, is one of the borough jail facilities planned to replace the Rikers Island complex, a reminder that not every large filing this quarter is residential.
Total and Average Floor Area by Borough
Total Floor Area Filed by Borough
Millions of square feet, average quarter 2025 vs. Q1 2026
Manhattan's average filing size, at roughly 189,500 square feet, is effectively skyscraper-scale. Brooklyn and the Bronx average closer to a 40-to-50-unit apartment building, Queens sits at about half that footprint, and Staten Island remains the only borough where the average filing size actually declined, a reflection of a construction pipeline that stays overwhelmingly low-rise and single-family.
What This Means for Buyers and Sellers
It is worth separating this pipeline from the resale market most of our clients transact in day to day. New building permits take years to become finished, occupied residences, so this quarter's filings will not move current inventory in the way a wave of resale listings would. What they do signal is where supply is headed over the next several years, and that matters for anyone thinking about the long-term trajectory of a neighborhood, not just this season's comparables.
Hudson Yards, already home to some of the city's newest ultra-luxury towers, is clearly entering a second wave of development, which should keep the neighborhood's new-development inventory deep for years to come. Meanwhile, growth in Brooklyn reinforces a trend we have tracked closely in our Brooklyn Luxury Market Overview: the borough continues to close the gap with Manhattan in both scale and sophistication of new construction.
For buyers, a larger construction pipeline is generally good news over the medium term, more choice, more competition among developers, and eventually more moderation in new-development pricing. For now, though, the luxury resale market remains defined by scarcity, as we detailed in our Manhattan Luxury Market Report for Q1 2026, and financing conditions continue to shape both new and resale demand, a dynamic we cover in depth in our analysis of how interest rates are reshaping NYC luxury real estate. If you are weighing a new-development purchase against a resale property, our guide on understanding luxury home valuations and our step-by-step guide to buying a luxury apartment in NYC are useful starting points, and our list of emerging neighborhoods for investors digs deeper into areas like Sunset Park and the broader Brooklyn waterfront.
Given the sustained political and popular momentum behind upzoning and new housing construction across the city, state, and country, we expect this pipeline to keep expanding through the rest of 2026. We will continue tracking these filings alongside our quarterly market reports and will update this analysis as new data becomes available. For a broader look at where the market is headed this year, see our NYC Real Estate Market Forecast for 2026, or browse our current exclusive listings and full neighborhood directory to see how this pipeline lines up with what is available today.